Algorithms for Agriculture
Posted on : October 16, 2021 Reading Time: 10 mins
 One of the real applications I am working on uses geographical data from the route of agricultural machines to obtain a series of relevant statistics. I mainly use the Pandas, GeoPandas, and Shapely libraries.
I will discuss some of them following the reasoning that led me to solve the problems that arose.
Problems and Available Resources
We have a series of data on the route of a machine, with its geographical position and status (working, not working).
 Based on this, we need to obtain all relevant information that helps measure the work done.
Some of these statistics are:
- Hectares worked
- Overlapped area
- Distance between 2 worked rows
- Detection of headers
To help someone unfamiliar understand how these machines work, I’ll provide a brief summary.
Agriculture Machines
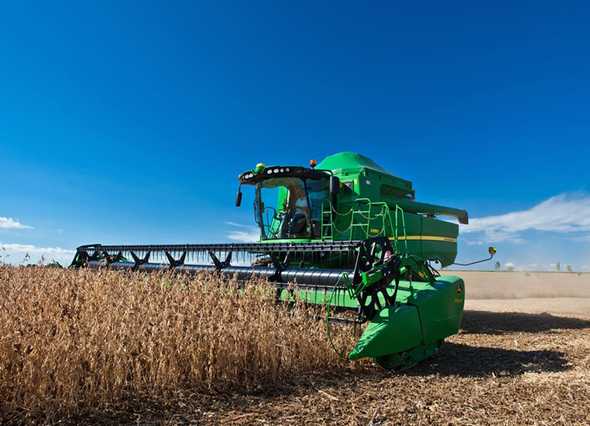 There are mainly 2 types of machines we monitor, planters and harvesters.
Planters sow seeds in a field while harvesters pick up the product once it grows.
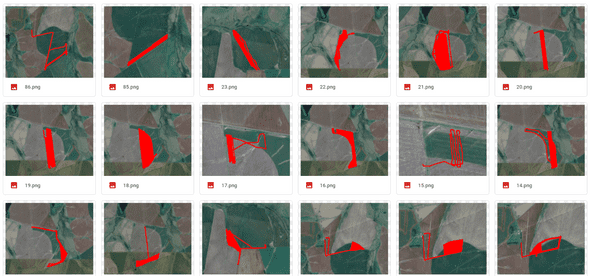
What they have in common is how they behave, the machines have an area to sow/harvest, and they cover it in a zigzag pattern.
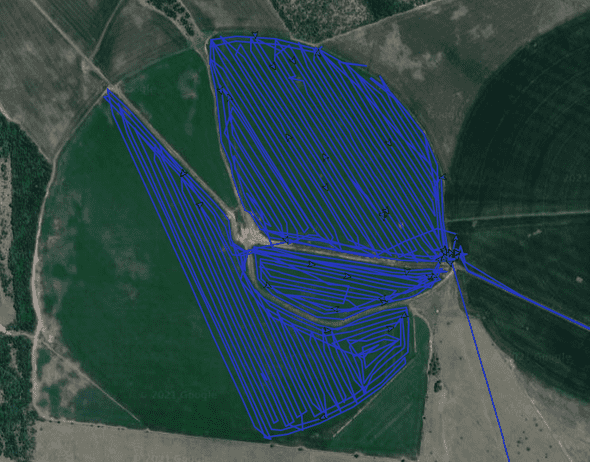 Here is a representation of a machine’s route.
Algorithm 1 - Detection of Headers and Work Lines
An important piece of data is that at the end of a work line, the machine lifts the head to make a 180-degree turn and move on to the next line.
While this occurs, the machine does not harvest or sow, so those pieces should be discarded. For this, first of all, we must detect these cases and separate them from the work lines themselves.
The algorithm I developed uses changes in the GPS angle to detect these 180-degree turns, and compares them with the time from the last data point. This way, we can have a ratio of angle variation over time. When it exceeds a certain value, it is estimated that the machine is making a turn sharp enough to be considered a header.
The steps to get to this result are:
- Calculate the difference in angle between the previous and current data. It is relevant to take into account that when passing from angle 0 to 359 there is not 359 degrees of distance, but 1.
- Calculate the time difference from the previous and current data.
- Calculate the ratio between angle variation and time variation.
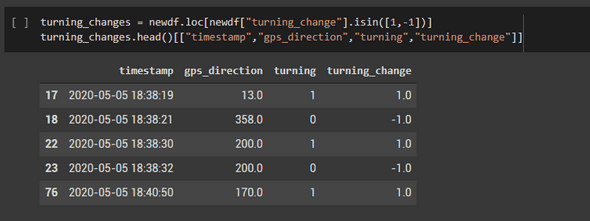
- Data with a turnrate higher than 12 (a magic number obtained by trial and error) are given a “turning” flag = 1, and a 0 is assigned to the other data.
- Add a column with the difference between the “turning” state of the previous data and the current one. In those data where the difference is 0, it means that the previous state was maintained.
In this way, if I filter those rows with a state change of 1 or -1, what I obtain are the rows that begin a period of rotation or a line period.
If I separate the original dataframe using the rows from the previous step, I obtain multiple data segments, where work lines and headers alternate.
In the following images, you can see the results, where the points that make up the work lines are shown in blue and the headers in red.
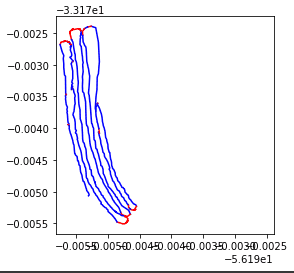
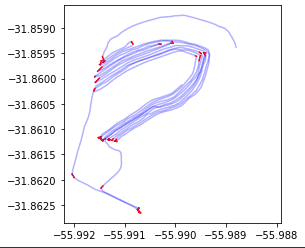
With some later optimizations, the result improves noticeably.
Algorithm 2 - Detection of Interrow Distance
A data point that is relevant for some clients is the distance between one work line and the next.
This algorithm requires the operator to work in a zigzag pattern, moving from one work line to the next in an orderly fashion.
The work lines are irregular and consist of hundreds of points, so the algorithm with which I solved the problem is as follows:
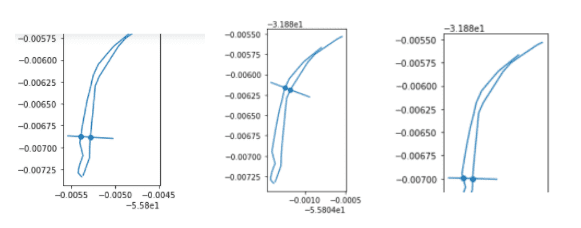
- Take a series of random points (from now on A) from a line and for each of them draw a perpendicular line (from now on P).
- These lines are intersected with the next work line at a point (from now on B).
- Measure the distance between A and B.
- Calculate the median of these distances.
While there is quite an approximation in the algorithm, with this approach, a precision is obtained that is even greater than that of measurements made manually in the field, as dozens of samples can be obtained for each work line.
Algorithm 3 - Detection of Work State through Machine Learning
A need that arose was to detect the working state of a machine (planter or harvester), as some do not carry a sensor that tells us when it is working, or in other cases, the sensor fails.
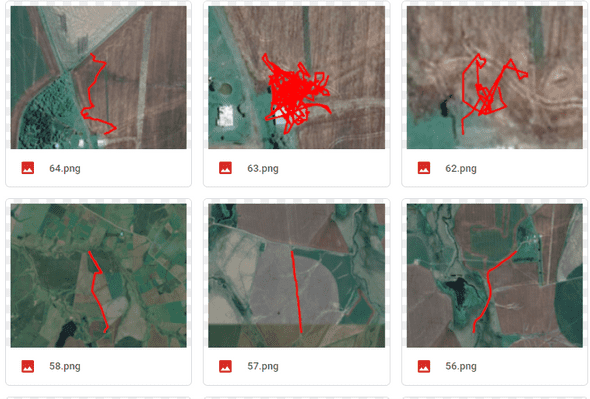
This algorithm uses historical data of the route of harvesters and planters while they were working, and data from periods when they were not working, and trains a machine learning model that can visually determine when a machine is making a route according to a work state and when it is not.
